Finally, we get to the most interesting part. Performance. Is Astro worth it?
Reminder: we have two identical websites. One is written on Next.js. The second is written on Astro.
Hosting
We made the testing environment as fair as possible. Both websites use SitecoreAI (XM Cloud) as the source of data. Both websites are hosted on Vercel on a free plan. Both websites are using Incremental Static Regeneration (ISR) with a revalidation period of 5 minutes. Images are delivered from the Sitecore Experience Edge. Multisite is based on Vercel middleware. This setup allows us to make sure that there is zero influence of hosting on the results.
Content
Websites have multisite configurations. There are two websites: Financial and Services. We have 138 pages in total. 39 pages for the Services website and 99 pages for the Financial website. There are 3 languages on each website: English, French and Japanese.
The content corresponds to the content in the official Sitecore Verticals Next.js Demo website repository. No additional pages were added or removed.
Testing Methodology
We use Lighthouse as a tool for measuring performance. It is the most popular and easy-to-use performance tool. You can easily run it in the browser or using CLI.
We make “warm-up” requests for each page before running the tests. It allows us to make sure that all pages use Vercel cache to avoid any networking effect on the test results.
We run 5 tests for each page and calculate the average values. It allows us to make sure that there are no random bad or good results. Adding more tests doesn’t add any difference, that is why we decided to stop on this amount.
We executed our tests multiple amount of times. And we can confirm that results are permanent and easily reproducible.
The performance testing script is present in the repository, feel free to review it if you want more details.
Results
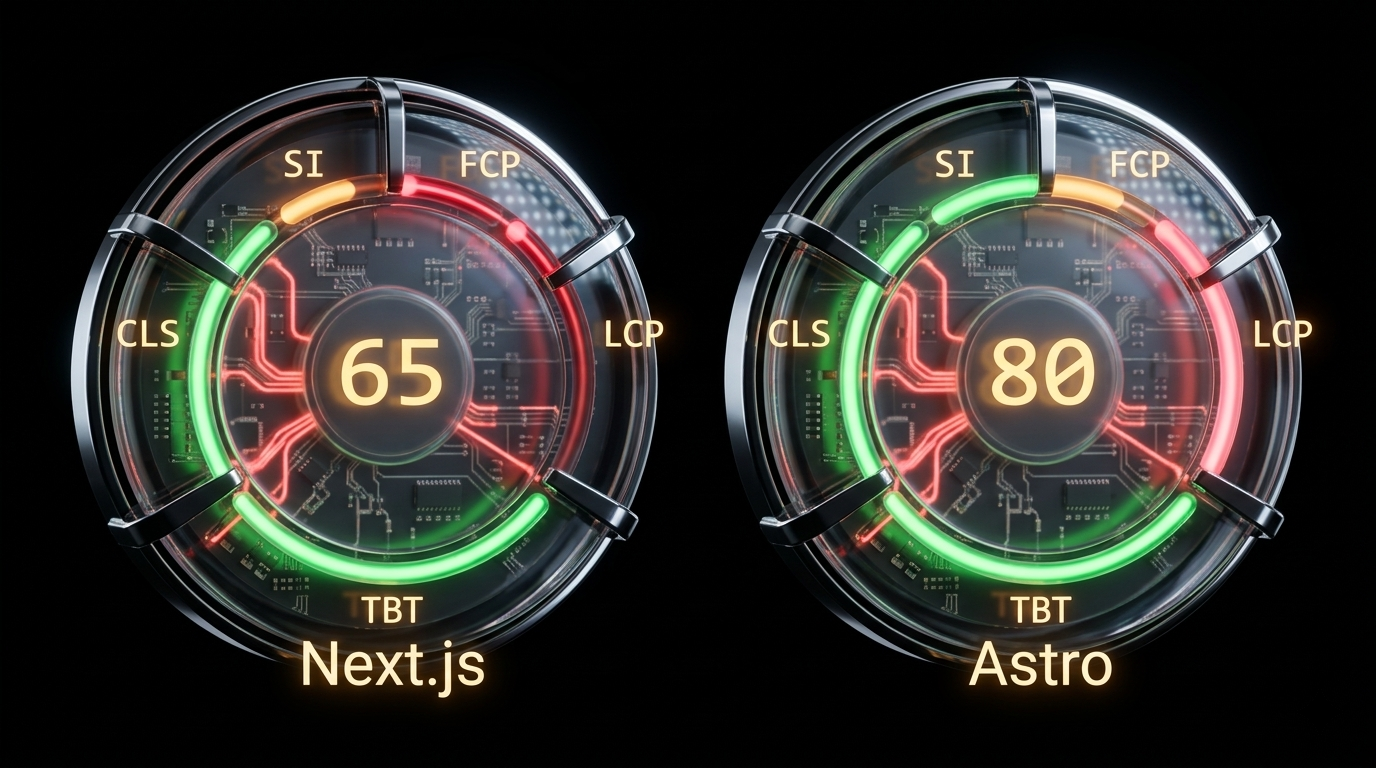
Lighthouse(version 10) has five metrics. Each metric has a different influence on the final score. These metrics are First Contentful Paint(FCP,10%), Speed Index (SI, 10%), Largest Contentful Paint(LCP, 25%), Total Blocking Time (TBT, 30%), Cumulative Layout Shift (CLS, 25%).
Here are the average results for the Next.js and Astro websites:
| Metric | Next.js | Astro |
|---|---|---|
| Performance |  |  |
| Performance | 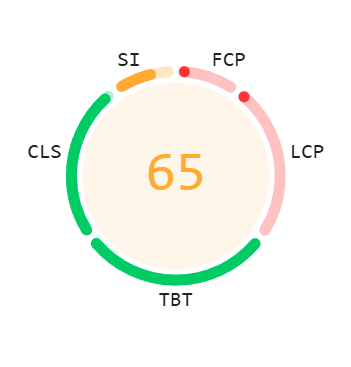 | 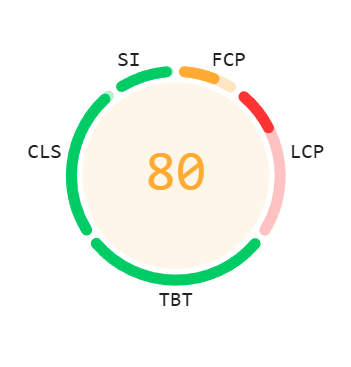 |
| First Contentful Paint | 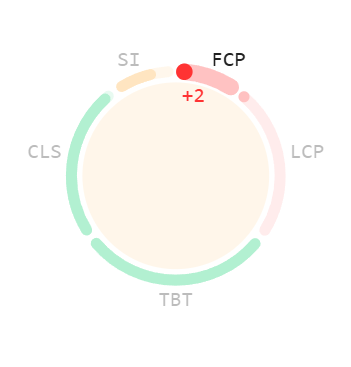 | 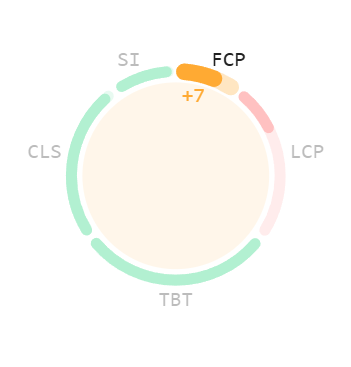 |
| Largest Contentful Paint | 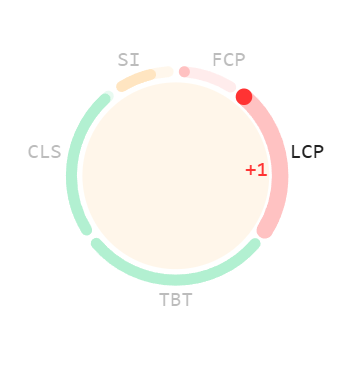 | 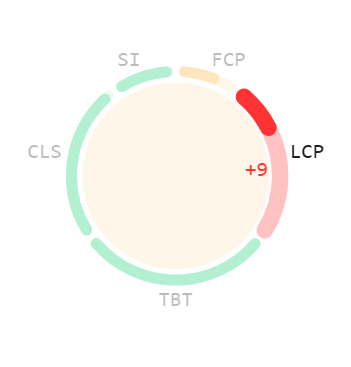 |
| Total Blocking Time | 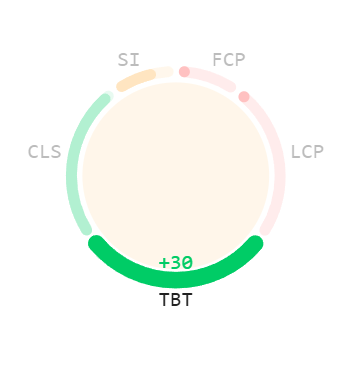 | 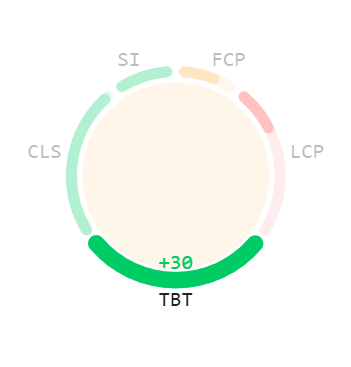 |
| Cumulative Layout Shift | 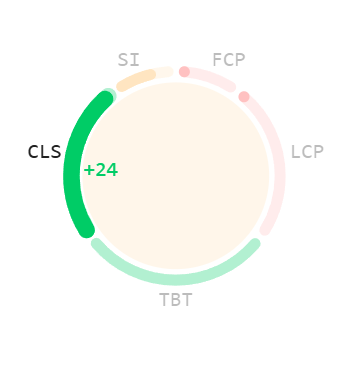 | 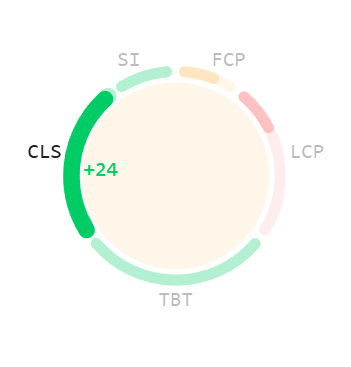 |
| Speed Index | 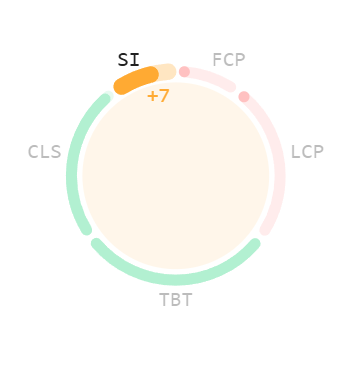 | 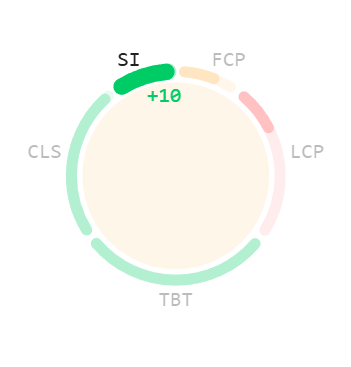 |
We have a +15 better score for Astro on the website with the same functionality and the same content. Astro has the same scores for cumulative layout shift and total blocking time as Next.js. But Astro shows much better performance scores for speed index, first contentful paint, and largest contentful paint.
Behind these scores is the time. It is how fast your webpage is loaded. The average Next.js First Contentful Paint takes 4300ms. The average Astro FCP takes 2400ms. Astro is faster at 1900ms. It is almost 2 seconds, which is a huge improvement.
The average Next.js Largest Contentful Paint takes 7850 ms. The average Astro LCP takes 4800ms. Astro pages are quicker than Next.js pages by more than 3 seconds!
2 seconds for FCP and 3 seconds for LCP are really big differences. And it can have a big effect on your website conversion.
The next graph shows the difference in the Lighthouse score per page.
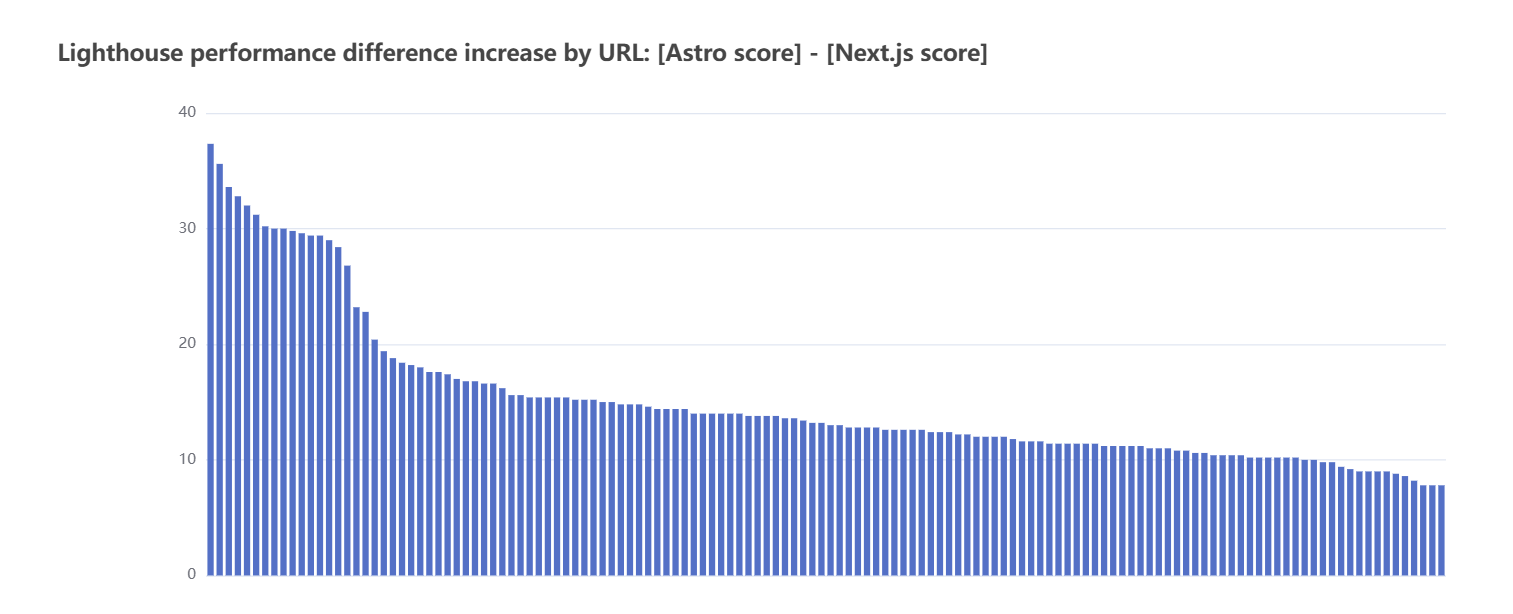
All Astro pages showed better scores than the Next.js pages. The general rule is that the more complex a page is, the better its score on the Astro website.
The next graphs show the differences between Astro and Next.js for First Contentful Paint and Largest Contentful Paint.
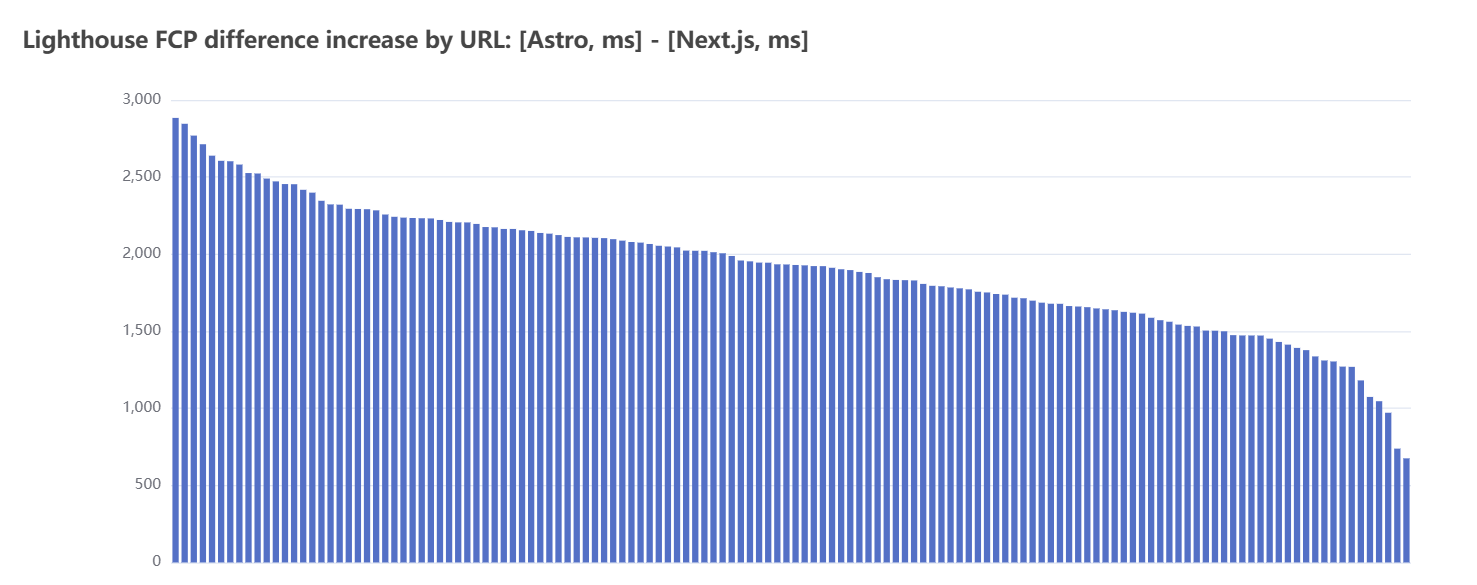
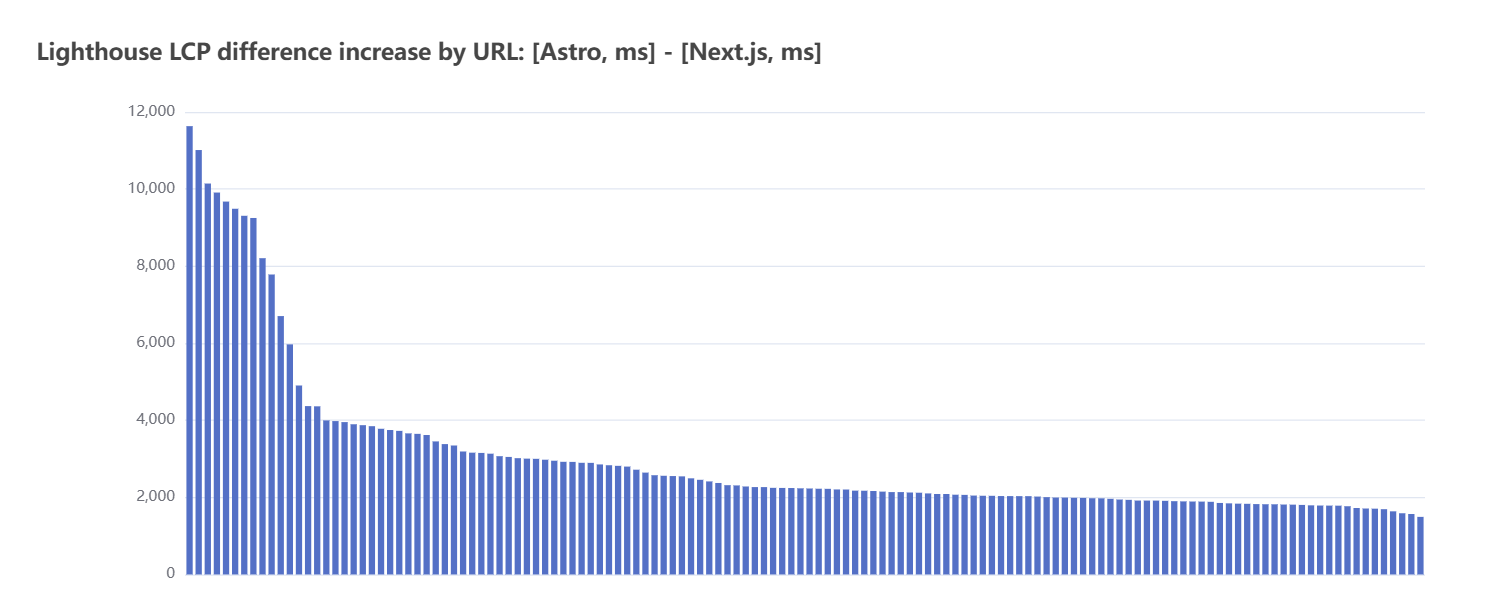
If you studied probability theory at the university then probably you noticed that the FCP graph is a normal (also as known as Gaussian) distribution. The smallest increase in FCP time is 0.6 seconds. The smallest increase in LCP is 1.5 seconds
Conclusion
Performance testing of the two the same websites, but on different frameworks shows that Astro has a huge advantage compared to Next.js. Average First Contentful Paint was improved by about 2 seconds. Average Largest Contentful Paint was improved by about 3 seconds! These are big improvements that can affect customer conversion on your website. Give Astro a try! Run it locally, or run it on Sitecore Demo Portal and if it fits your needs use it for your Sitecore website to get better results!