
Traefik Dashboard and Access Logs Sitecore Docker Configuration
Sitecore Docker Containers are already widely used for a few years. I have seen many different configurations on different projects. All of them could be divided into 2 groups: with reverse proxy and without reverse proxy. You can live without reverse proxy and traffic orchestration if you have only CM and CD. But things become complex when you have other services: Identity Server, Horizon, etc. And it is much easier to get everything to work with a reverse proxy.
And all the times, when I saw Sitecore Docker setup was with a reverse proxy, it was Traefik. Indeed, it can be any other reverse proxy: nginx, reproxy. But all the time it was Traefik. I think there are 2 reasons, why it is so. First, is that Traefik has a Windows Docker image. And we don’t need to run Windows and Linux containers simultaneously. The second reason is that Sitecore Docker examples were provided with Traefik. And that is a similar story to how gulp became so popular in the Sitecore world. If you have a working example, why do you need to reinvent the wheel?
Now, let’s talk about 2 Traefik features that could be useful for better understanding what is going on with your Traefik container.
Dashboard
Traefik has a dashboard. You may find a port for it in your docker-compose.yml file.
services:
  traefik:
	...
    ports:
      - "8079:8080"
It means that http://localhost:8079/ in my case will be an URL to the dashboard.
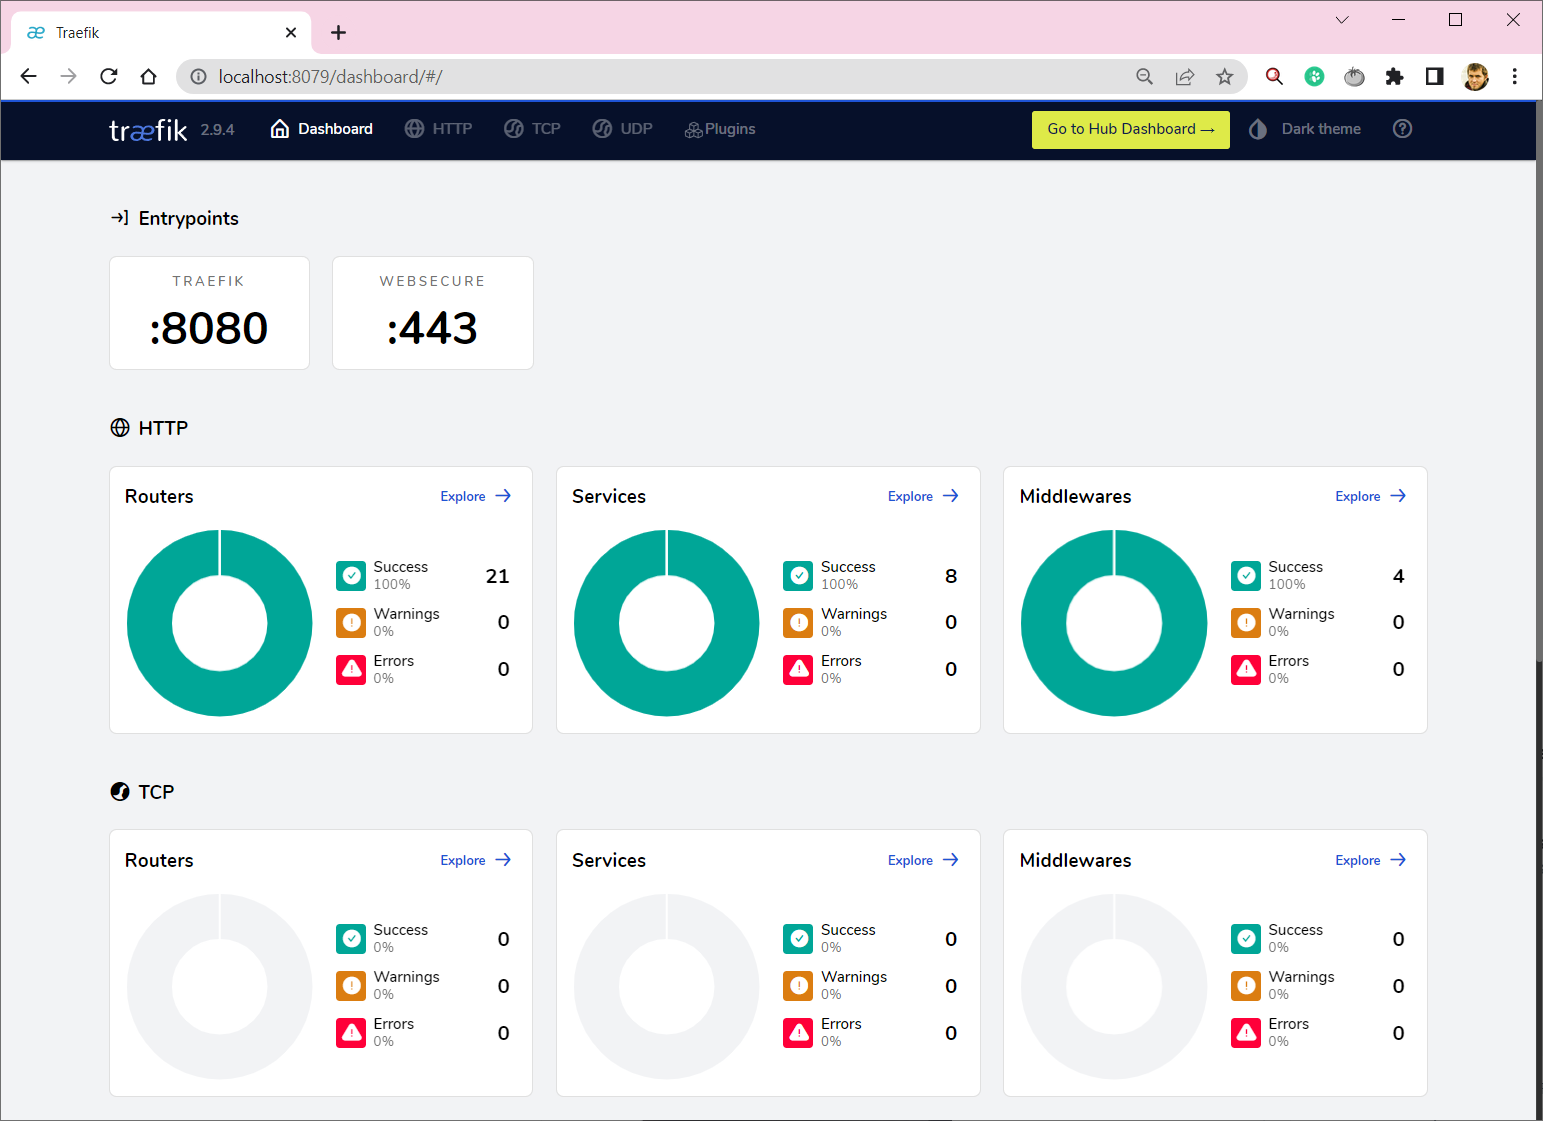
It is not very useful if everything is working. You will get just green circles. But if there is something wrong, it is the right place to identify what. And it can give you a clue: what is wrong and what you need to fix or reconfigure.
Access logs
When you run Docker for MVC/SXA solution, you can find all access logs that you need in your CM/CD Docker container under C:\intetpub\logs\logfiles\w3svc1 . It is the usual IIS logs location. When you run a headless setup, you don’t have access logs to your rendering host, but you can configure Traefik to get it.
You need to add 2 parameters accesslog to enable logging and accesslog.filePath to setup the path to log file inside your container. And also you can map Docker volume in order to have easy access to them. You will not need to go inside Traefik container in order to get them.
services:
  traefik:
    command:
      ...
      - "--accesslog=true"
      - "--accesslog.filePath=/logs/access.log"
    volumes:
      ...
      - ./docker/data/traefik:c:/logs/
You will get logs for all requests that comes through Traefik to your containers. But, be aware, if you have some traffic inside your Docker network(e.g. requests to rendering host in Experience Editor mode) then it will be not visible for Traefik and will not be logged.